To calculate result you have to disable your ad blocker first.
Empirical Rule Calculator
Write the value of Mean and Standard Deviation and hit on calculate button to check the distribution of data by using this empirical rule calculator.
Empirical Rule Calculator
Empirical Rule Calculator is a tool that takes mean & standard deviation as input and calculates the percentage of data points that fall within one, two, or three standard deviations from the mean, based on the Empirical Rule.
What is the Empirical Rule?
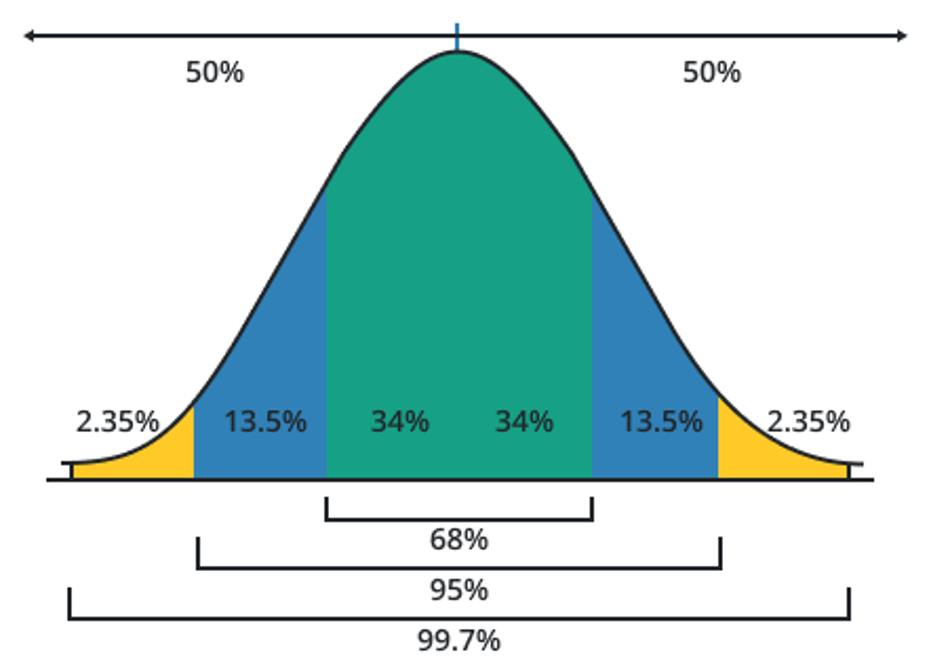
A statistical principle known as the Empirical Rule sometimes referred to as the 68-95-99.7 rule or the three-sigma rule, offers a rough estimation of the distribution of data in a normal or bell-shaped distribution.

The purpose of making this rule is the idea that, in a normal distribution. The Empirical Rule asserts that if X is a random variable with a normal distribution and a mean and standard deviation, then P (- X +) 0.68 (about 68% of the data) and P (- 2 X +) 0.95 (roughly 95% of the data).
- P (- 3 X + 3) 0.997 around 99% almost all.
Remember that the Empirical Rule functions most effectively with data that roughly resembles a normal distribution. The rule might not be as reliable if the data considerably deviates from a normal distribution.
In certain situations, more complex statistical techniques could be needed to adequately assess the data.
Empirical Rule Formula
The Empirical Rule is used in statistics to represent data separation in a normal distribution. It gives a percentage of the total values of the data that fall within 1, 2, or 3 standard deviations from the mean. For this use the series of formulas that are written below:
- For the 1st-standard deviation of the mean use “μ – σ & μ + σ”, these values give range and surety that 68% of the data falls within this.
μ – σ ≤ X ≤ μ + σ
- For 2nd standard deviations use “μ − 2σ & μ+ 2σ” and it shows that 95% of the data falls in this range. Mathematically represented as:
μ − 2σ ≤ X ≤ μ+ 2σ
- For 3rd-standard deviations use “μ − 3σ or μ + 3σ” which represents the 99.7% of the data that falls within this range. In mathematical form is stated as:
μ − 3σ ≤ X ≤ μ + 3σ
Where:
- “μ” is the mean of the data.
- “σ” is the standard deviation of the data.
- “X” represents the values within each range.
Empirical Rule Examples
Here, we solve the manual examples by using the empirical rule formulas, which gives a complete understanding of performing the empirical rule on the data.
Example
Determine the data distribution when the mean (μ) = 32, standard dev (σ) = 12
Solution
Step 1:
First of all, we have to calculate the data falls between 68%:
= μ - σ, μ + σ
Step 2:
Putting Values in Formula:
= 32 - 12
= 20
= 32 + 12
= 44
Step 3:
Now we have to calculate the data falls between 95%:
μ - 2σ, μ + 2σ
Putting Values in Formula:
= 32 - 2(12)
= 32 - 24
= 8
= 32 + 2(12)
= 32 + 24
= 56
Step 4:
And then we have to calculate the data falls between 99.7%:
μ - 3σ, μ + 3σ
Putting Values in Formula:
= 32 - 3(12)
= 32 - 36
= -4
= 32 + 3(12)
= 32 + 36
= 68
Hence the result is given below with the percentage of data distribution.
68% of data falls between
20 and 44
95% of data falls between
8 and 56
99.7% of data fall between
-4 and 68
Frequently Asked Questions
What are the limitations of the empirical rule?
The empirical rule is a statistical principle that is used to understand the spread of data. However, it applies only to those data that follow a normal distribution (bell curve). If the data is not normally distributed then it does not reflect accurate information for distribution of the data.
What are the steps in using an empirical rule?
To apply the empirical rule follow some basic steps: First, find the mean “μ” and SD “σ” of data, if not given. Then use the series of formulas to find the data distribution for the different regions such as: 68% use “μ – σ & μ + σ”, 95% use “μ − 2σ & μ+ 2σ”, and 99.7% use “μ − 3σ & μ + 3σ”.
How to solve 68-95 and 99.7 rules?
The 68-95-99.7 rule is used to calculate the ranges of data by using the series of empirical rule formulas for 1, 2, or 3 standard deviations of the mean. For each value use their separate formula and get a range for the distribution of data. Also, use our empirical rule formula calculator.

